
Source of story ideas: Infographics
A question many writers get is “where do you get your ideas?” This question often originates from one of two sources: 1) a desire for a new writer to find that secret arterial idea spring, or 2) a reassurance that the author isn’t insane (I assure you that the idea to embed fingernails into The Bible was not based on an actual event in my life).
The truth is they come from everywhere. A mis-heard conversation, a sudden obsession with a particular song or painting, a dare; these things and more have been sources of my own stories for years. One of the recent areas where I’ve been seeing a lot of potential is infographics.
For those not aware, infographics are basically graphical ways to show data. Data can be boring. Colors and drawings are fun. Therefore, the infographic.
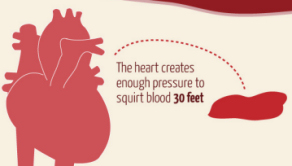
Below (way below, at the bottom of this post) I’ve included one such infographic that I think has some potential. I’ve isolated three of the data points following, and included a few initial thoughts on the possibilities each hold.
|
That’s incredible. Imagine a what the science of such projection would look like in the hands of a madman. Or, imagine a climatic (though probably funny) scene in which a man stabs a guy and gets hit in the eye with blood. |
 |
So, The Matrix was full of shit, then? Still, knowing how little amount of power the brain actually takes to function could make for some interesting machine/man hybrid stories. |
 |
Stomach acid harvested for use in either torture or construction. What about when someone is murdered by way of a knife to the stomach? Has acid ever leaked out, leaving a permanent scare on the hand of the killer? Perhaps in your story it has. |
The full infographic is below. Choose your own story source.

This is magnificent. I can definitely back up your sources. I spent half of friday night transcribing overheard party monologues. It’s amazing the context one can put something in, or not.
I can picture a chart similar to the above accounting for the inspiration behind Chartered Pieces.
A Charactered Pieces infographic, I like that. I may have to devote some time to that. Thanks.